Every published form now has a built-in analytics dashboard. Submission trends, completion funnels, traffic sources, and per-field breakdowns—right inside the form you already built.
No setup. No third-party tools. Open any form, click the Analytics tab. Your data is already there.
See where people drop off
Every form visit is tracked through three stages: viewed, started, and submitted. You see exactly where people drop off—and the conversion rate at each step.
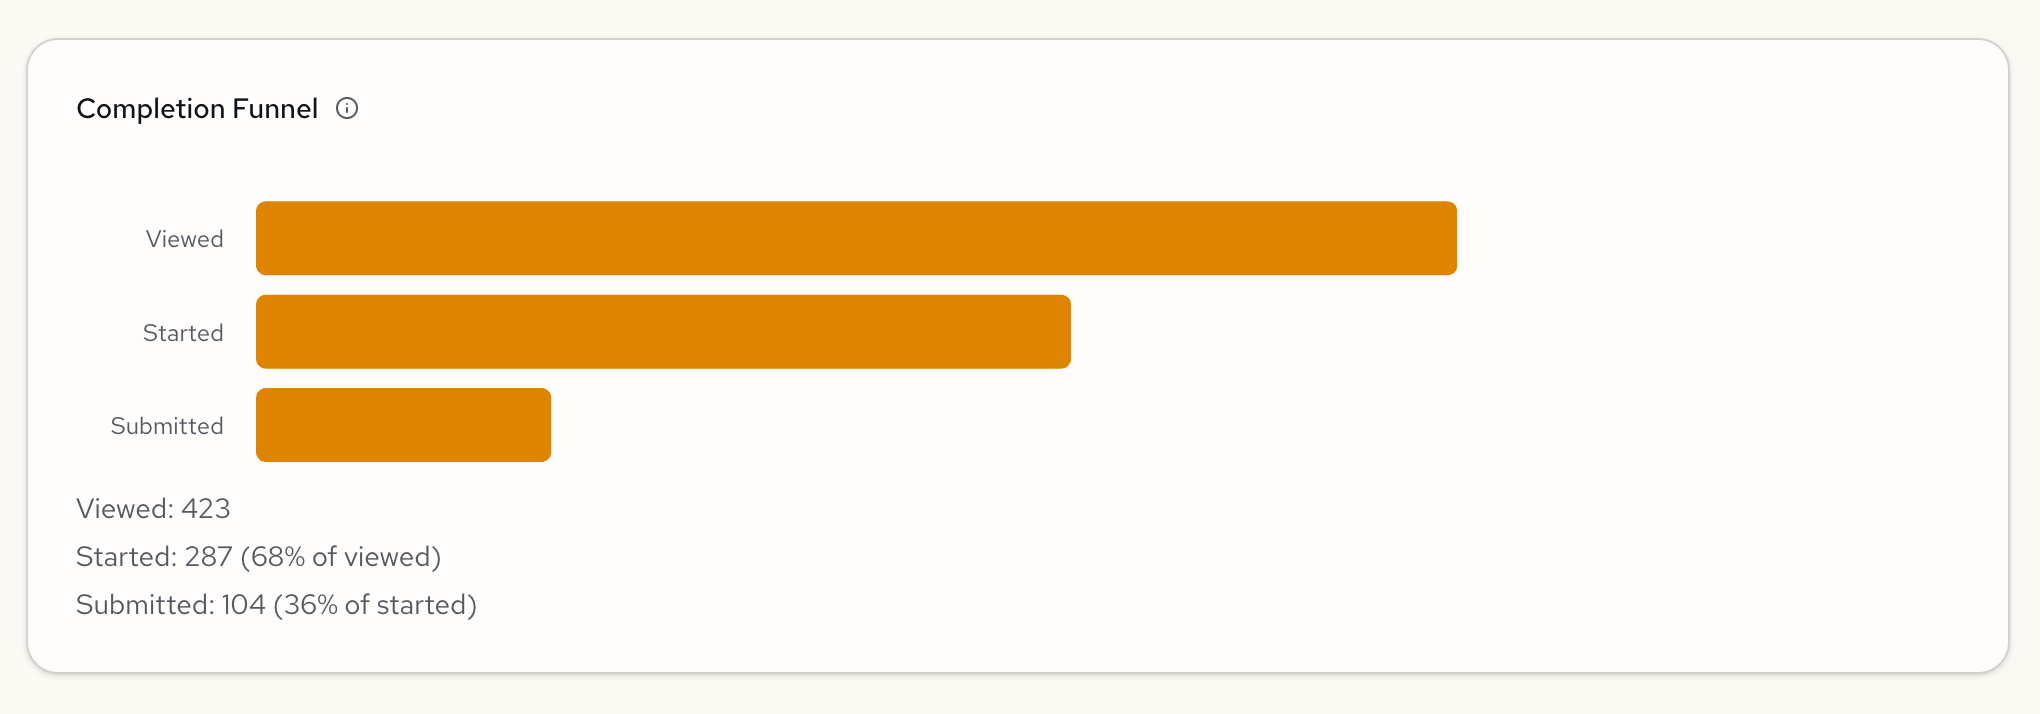
A low view-to-start rate? Your form title or description might need work. A steep drop between started and submitted? The form might be too long, or a specific field is causing friction.
Know where your traffic comes from
The dashboard breaks down who is filling out your form and how they got there. Top referrers show which channels drive responses—Google, direct traffic, social links. Device and country breakdowns tell you whether you're reaching the right audience.
Shared your form on LinkedIn? You'll see it in the referrer list. Targeting a specific region? Check the country breakdown. The data updates as submissions come in.
Every field gets the right chart
The dashboard reads your form specification and picks the right visualization for each field automatically.
Select fields become bar charts. Number fields get stats cards with mean, median, min, and max. Boolean fields become donut charts. Text fields show recent responses, or frequency charts when values repeat.
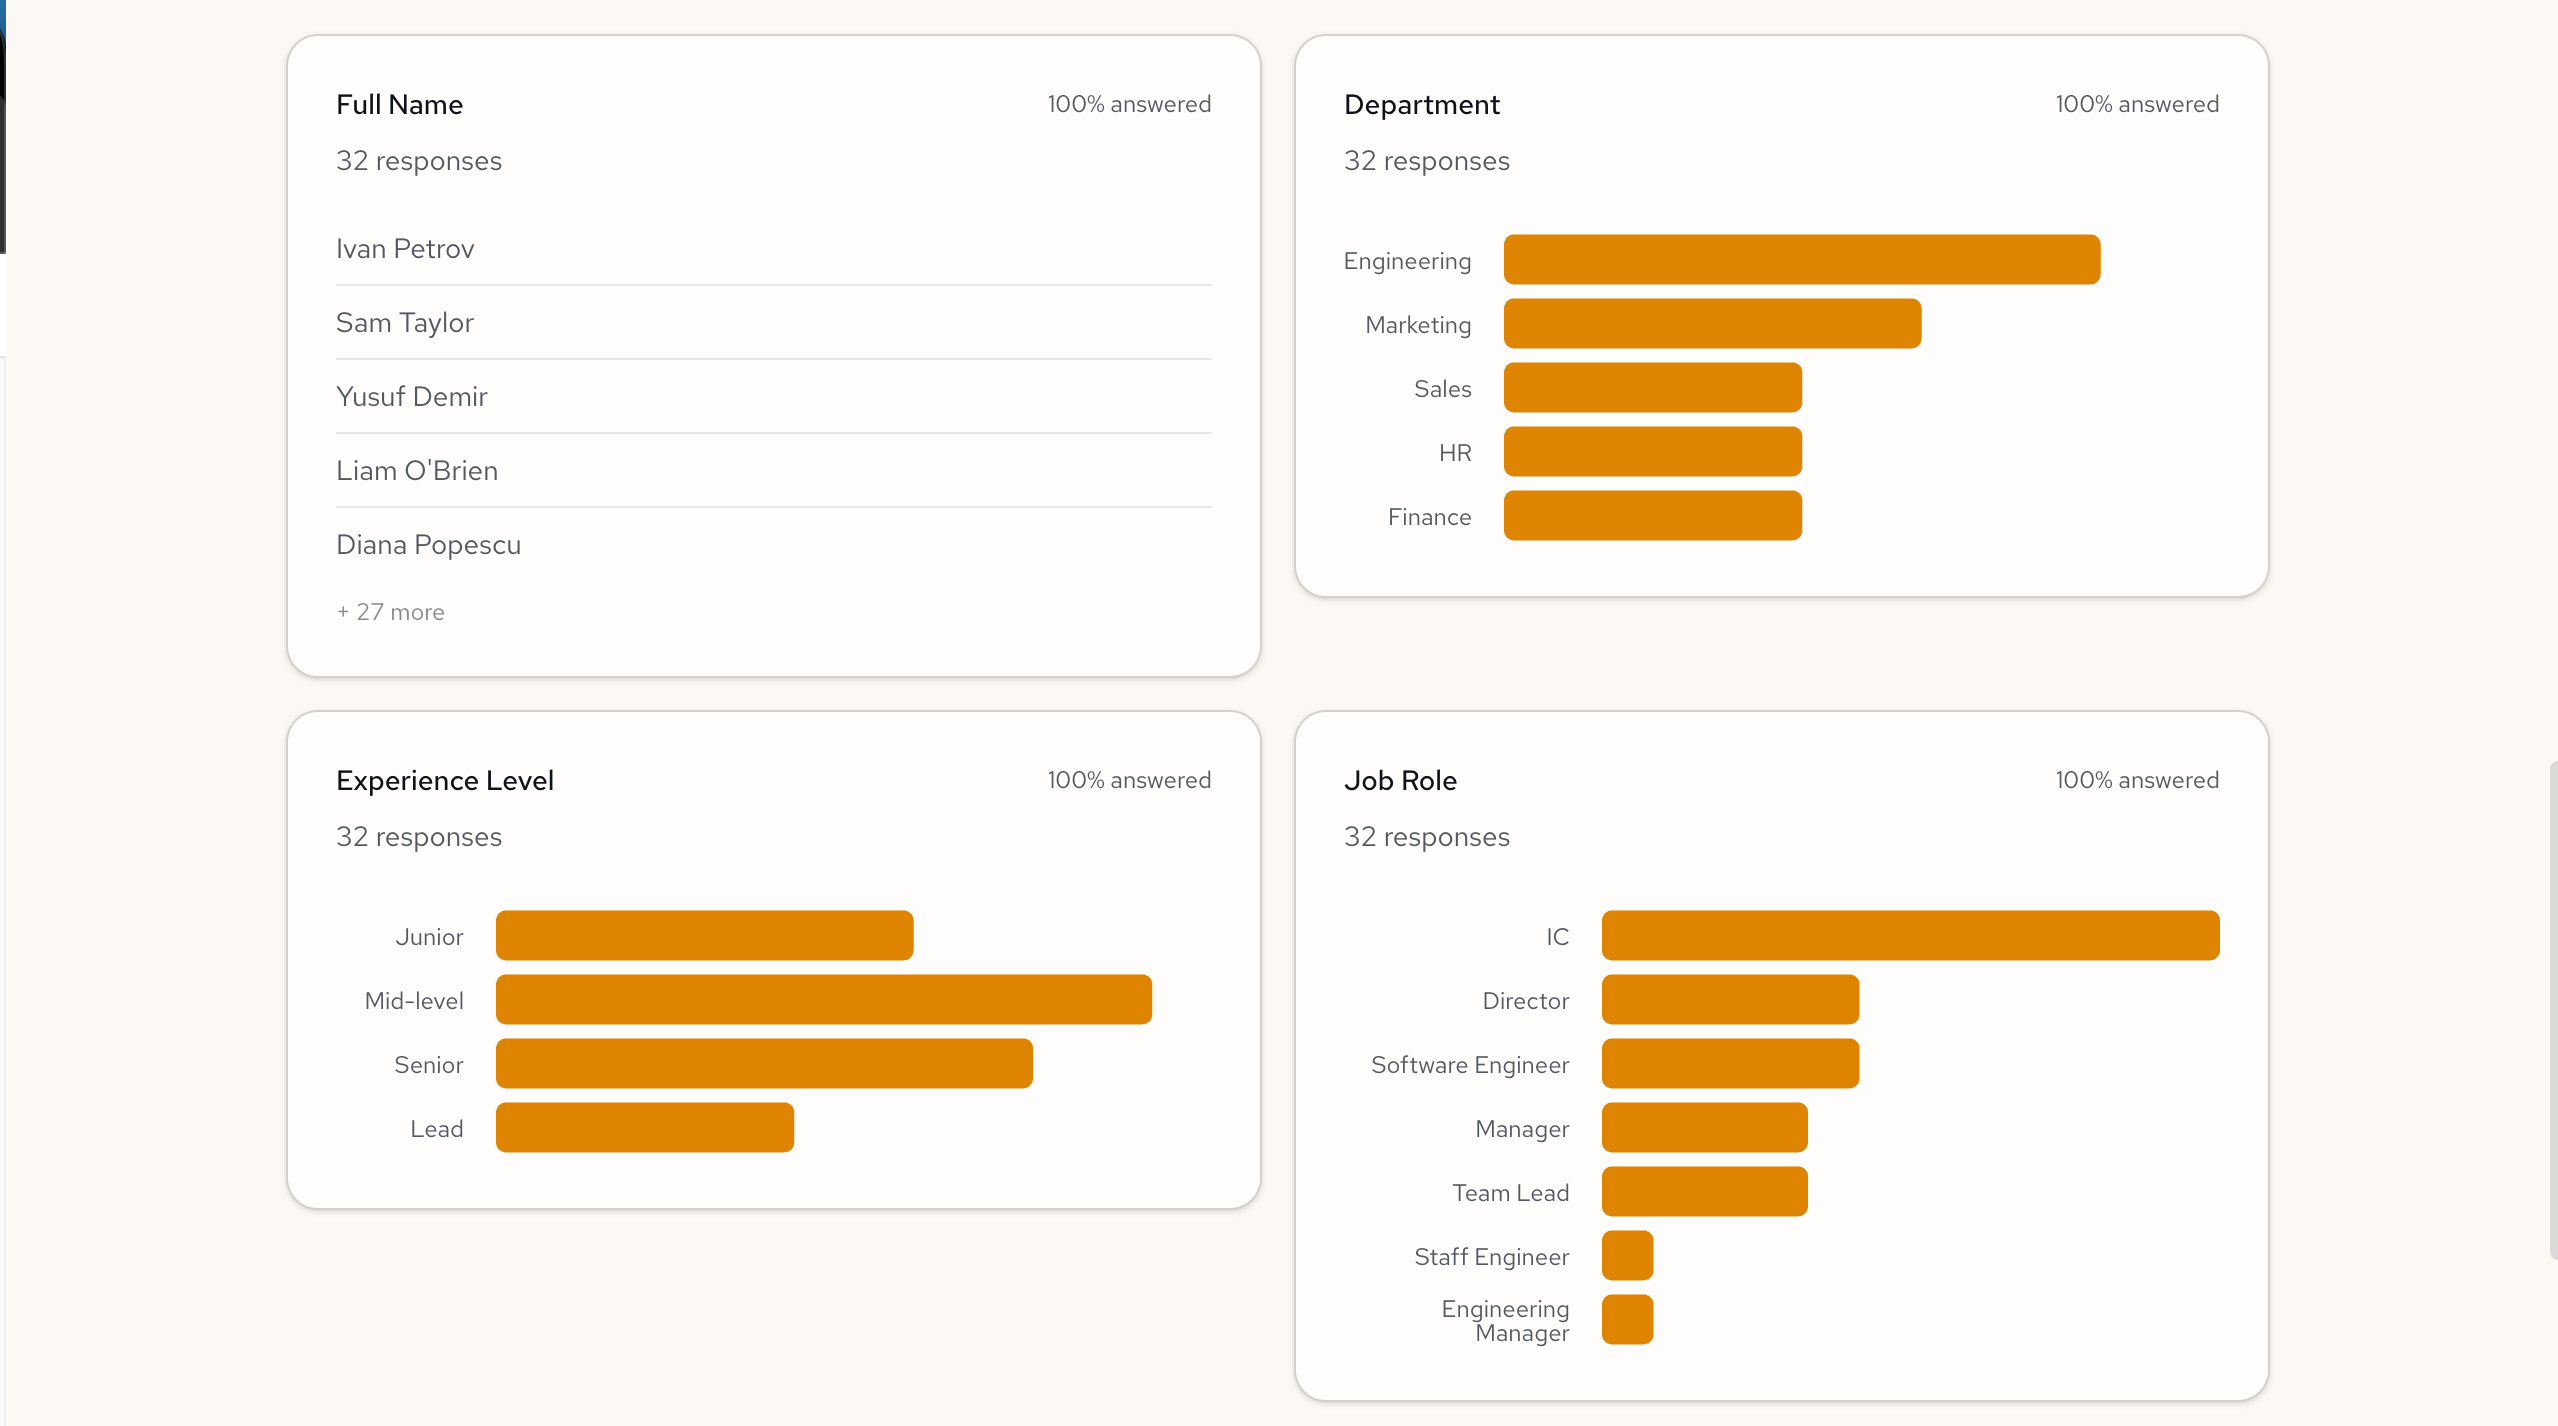
Add a department dropdown, see department breakdown. Add a satisfaction score, get the statistical summary. No configuration needed.
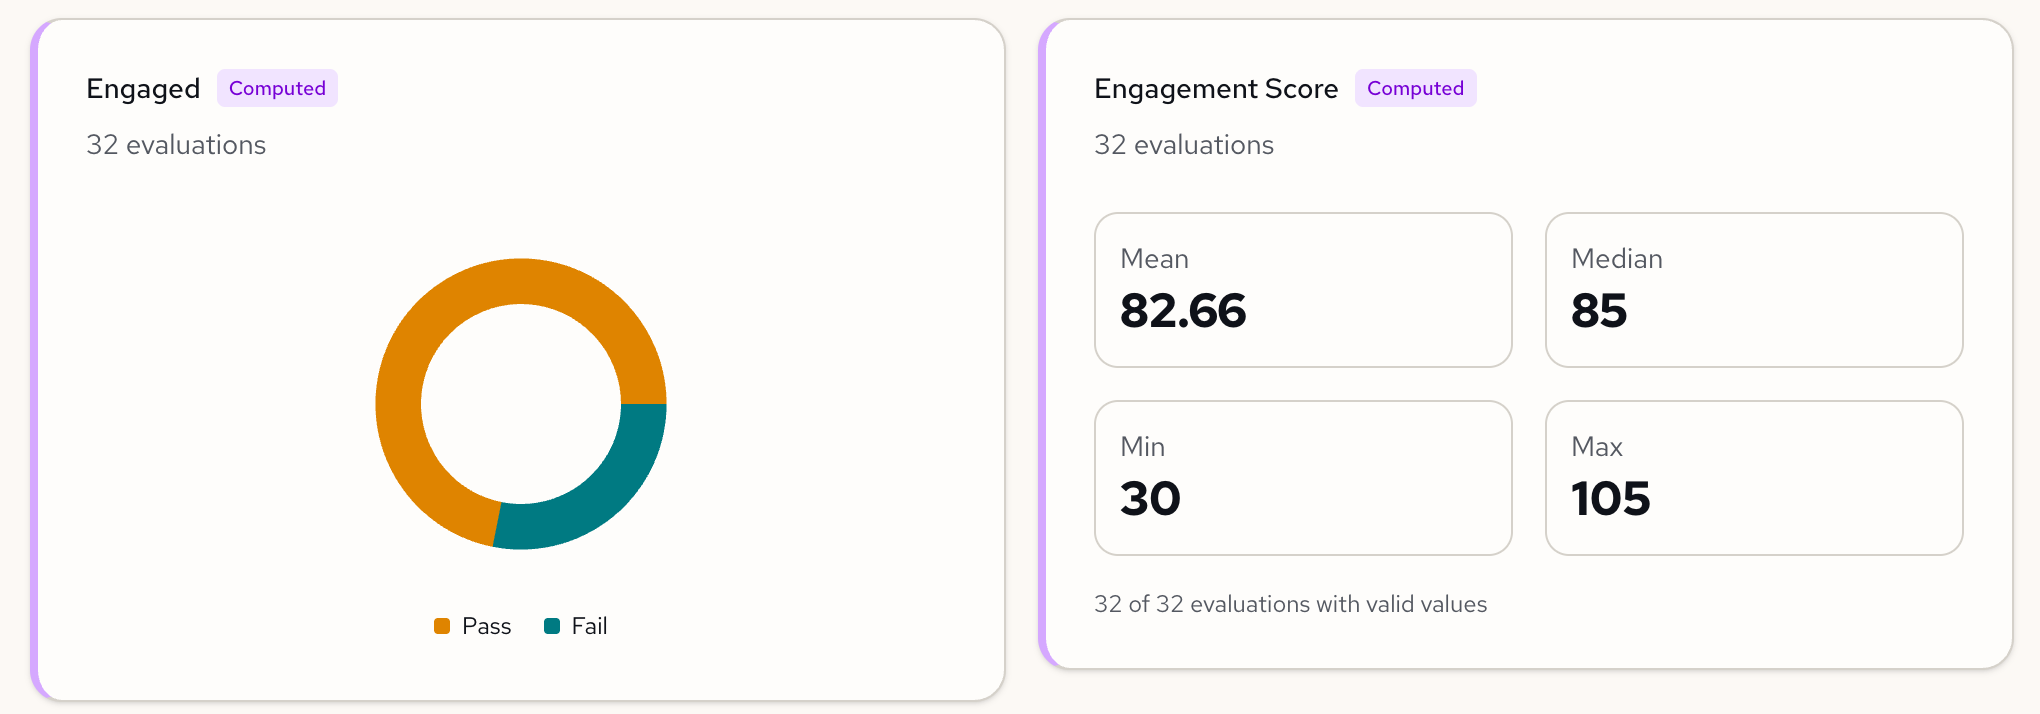
Computed fields are tracked too
If your form calculates results from inputs—like a risk score, eligibility check, or engagement metric—those results get their own analytics section.
Define an engagement score, and the dashboard tracks it across all submissions. Boolean expressions become Pass/Fail donuts, showing what percentage of respondents meet your criteria. Numeric results get the full statistical breakdown.
Define the logic. The analytics follow.
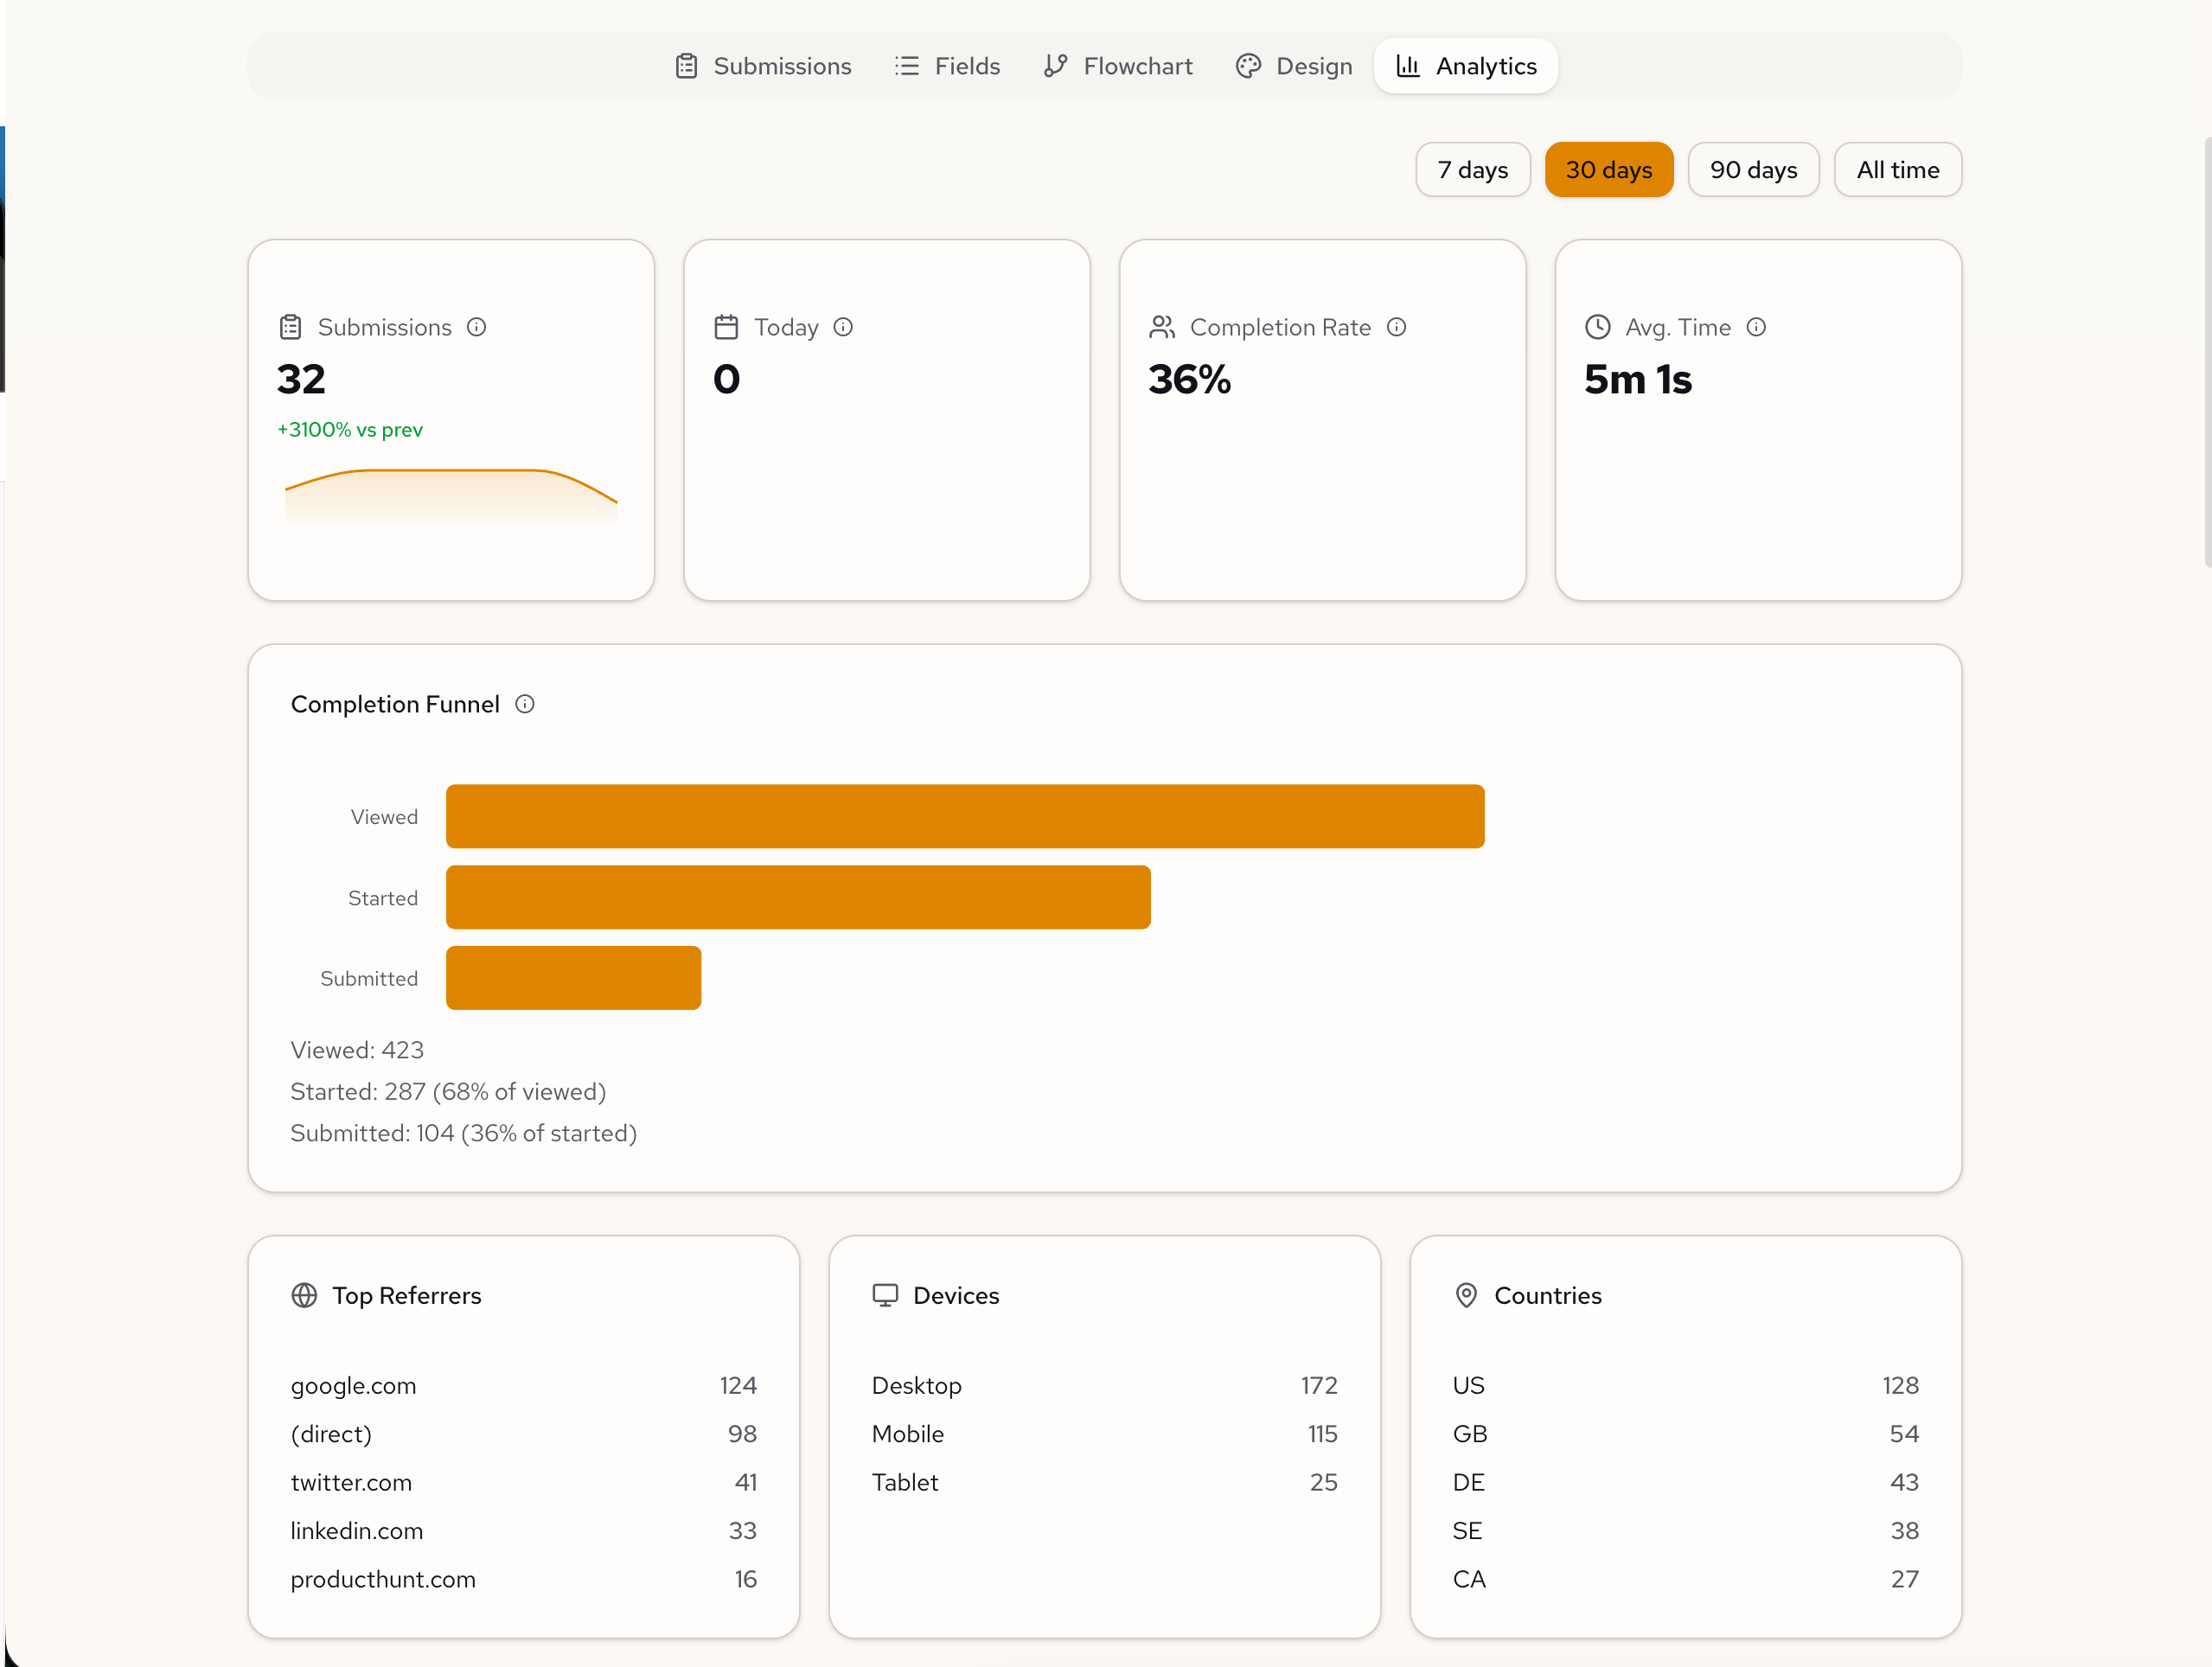
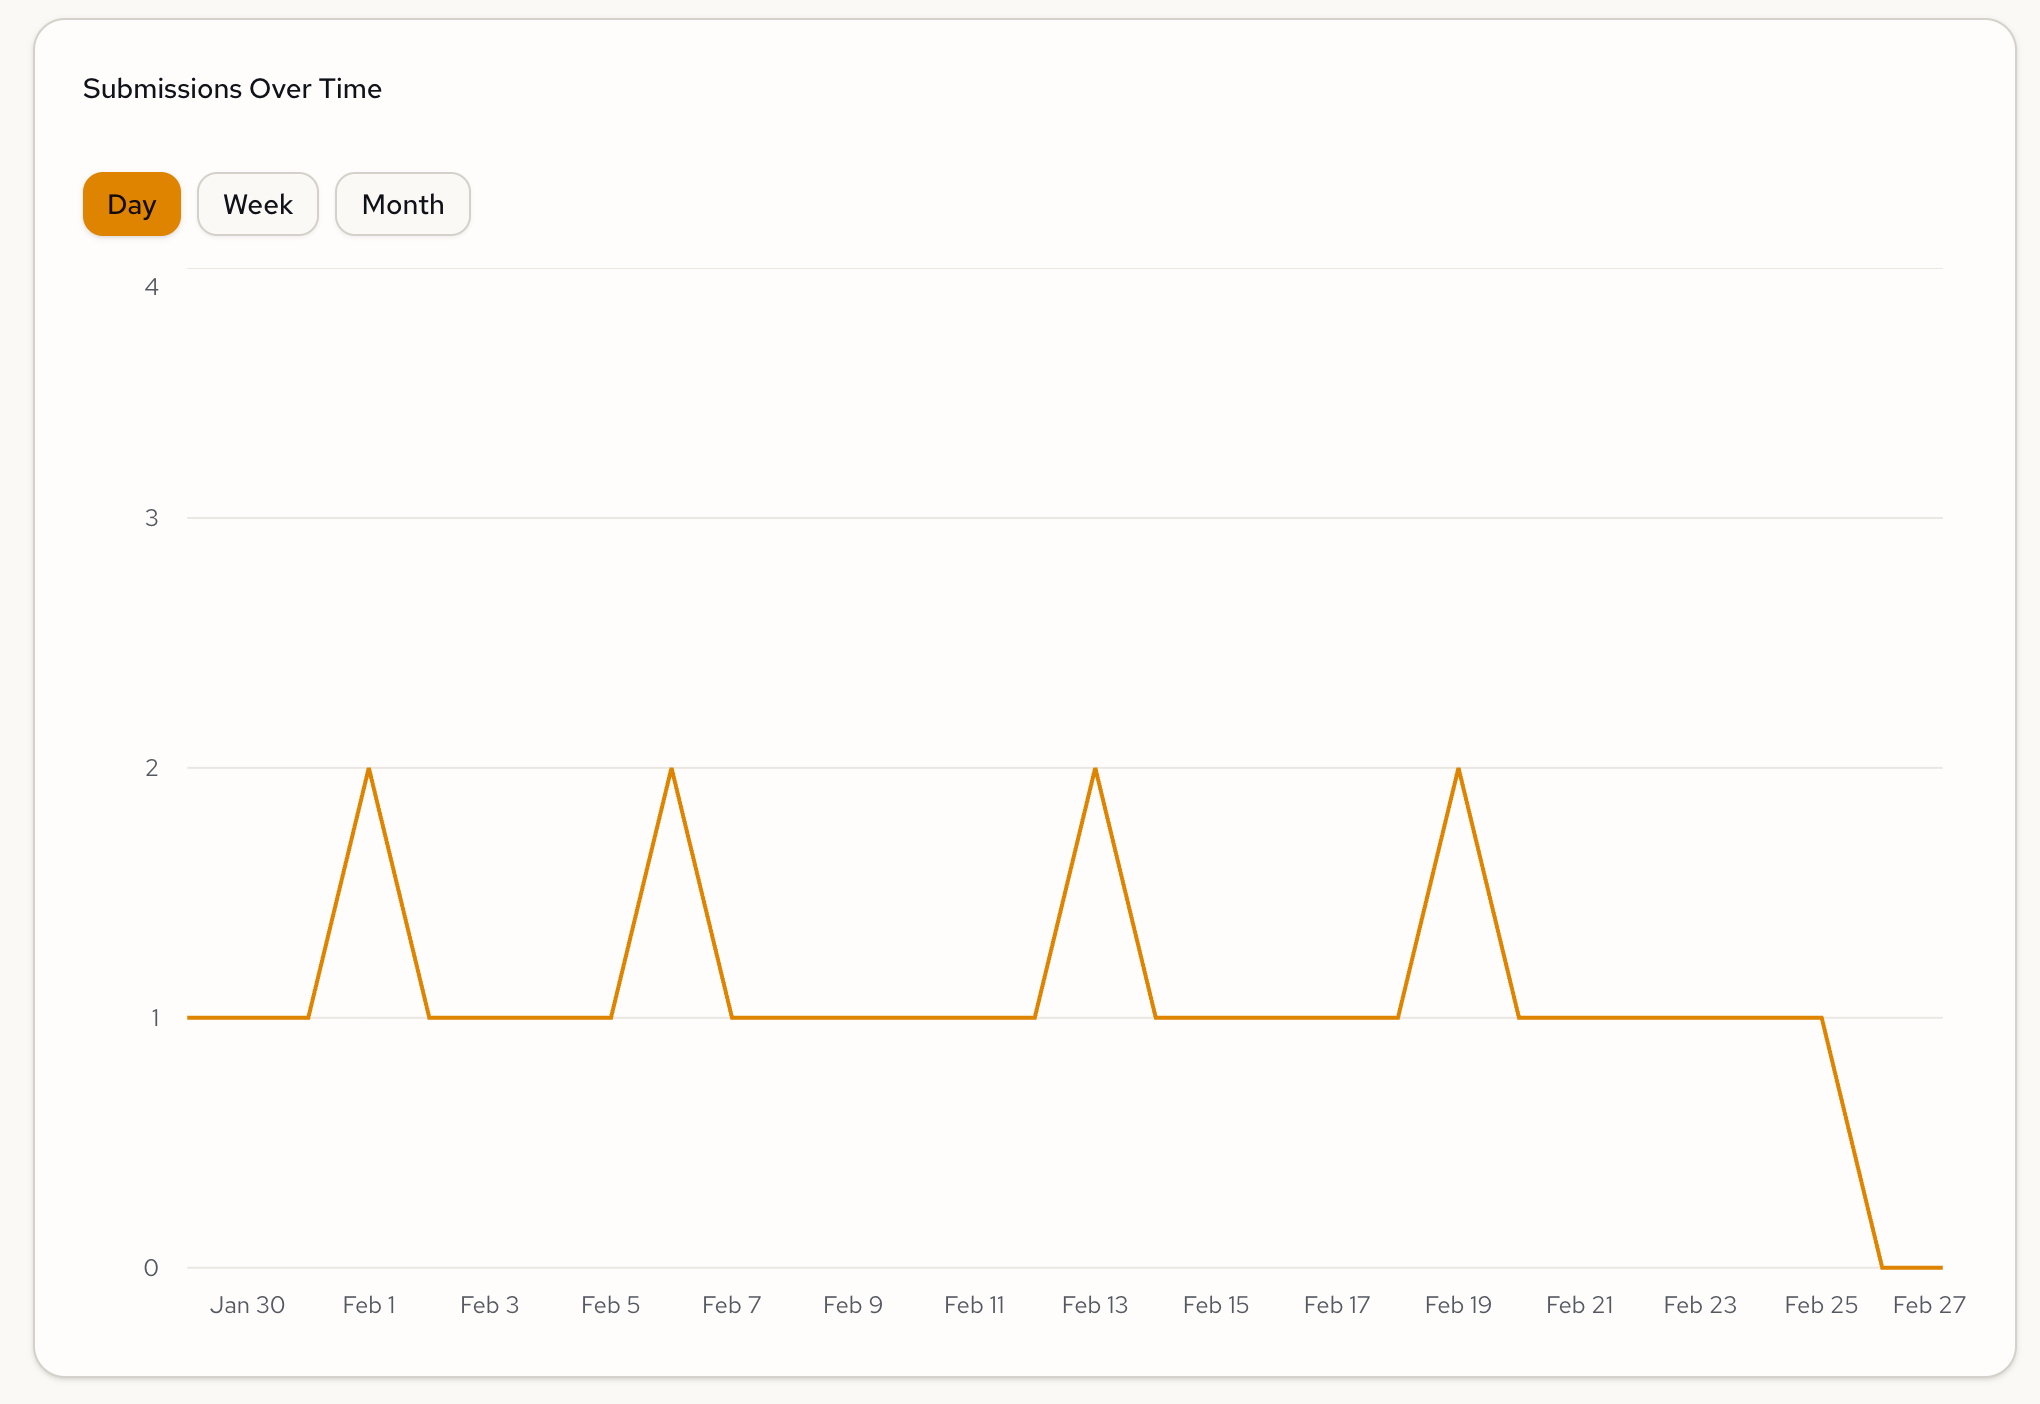
Filter by time, compare to last period
Toggle between 7 days, 30 days, 90 days, or all time. Every chart updates instantly. The submissions timeline shows trends by day, week, or month. Overview cards show period-over-period deltas so you can tell at a glance whether submissions are trending up or down—without exporting anything to a spreadsheet.
Try it
Open any published form and click the Analytics tab. If you have submissions, your dashboard is already populated.
New to Formidable? Sign up free and go from idea to published form with analytics in minutes.
Feedback? We're at hello@formidable.software.